Keith O'Conor is CTO and coder at Romero Games, and before that was a 3D Technical Lead at Ubisoft Montreal. He can be contacted at @keithoconor. Originally posted on his personal blog.
Performance is everybody's responsibility, no matter what your role. When it comes to the GPU, 3D programmers have a lot of control over performance; we can optimize shaders, trade image quality for performance, use smarter rendering techniques... we have plenty of tricks up our sleeves. But there's one thing we don't have direct control over, and that's the game's art.
We rely on artists to produce assets that not only look good but are also efficient to render. For artists, a little knowledge of what goes on under the hood can make a big impact on a game's framerate. If you're an artist and want to understand why things like draw calls, LODs, and mipmaps are important for performance, read on!
 To appreciate the impact that your art has on the game's performance, you need to know how a mesh makes its way from your modelling package onto the screen in the game. That means having an understanding of the GPU -- the chip that powers your graphics card and makes real-time 3D rendering possible in the first place. Armed with that knowledge, we'll look at some common art-related performance issues, why they're a problem, and what you can do about it. Things are quickly going to get pretty technical, but if anything is unclear I'll be more than happy to answer questions in the comments section.
Before we start, I should point out that I am going to deliberately simplify a lot of things for the sake of brevity and clarity. In many cases I’m generalizing, describing only the typical case, or just straight up leaving things out. In particular, for the sake of simplicity the idealized version of the GPU I describe below more closely matches that of the previous (DX9-era) generation. However when it comes to performance, all of the considerations below still apply to the latest PC & console hardware (although not necessarily all mobile GPUs). Once you understand everything described here, it will be much easier to get to grips with the variations and complexities you’ll encounter later, if and when you start to dig deeper.
Part 1: The rendering pipeline from 10,000 feet
For a mesh to be displayed on the screen, it must pass through the GPU to be processed and rendered. Conceptually, this path is very simple: the mesh is loaded, vertices are grouped together as triangles, the triangles are converted into pixels, each pixel is given a colour, and that’s the final image. Let’s look a little closer at what happens at each stage.
After you export a mesh from your DCC tool of choice (Digital Content Creation – Maya, Max, etc.), the geometry is typically loaded into the game engine in two pieces; a Vertex Buffer (VB) that contains a list of the mesh’s vertices and their associated properties (position, UV coordinates, normal, color etc.), and an Index Buffer (IB) that lists which vertices in the VB are connected to form triangles.
Along with these geometry buffers, the mesh will also have been assigned a material to determine what it looks like and how it behaves under different lighting conditions. To the GPU this material takes the form of custom-written shaders – programs that determine how the vertices are processed, and what colour the resulting pixels will be. When choosing the material for the mesh, you will have set various material parameters (eg. setting a base color value or picking a texture for various maps like albedo, roughness, normal etc.) – these are passed to the shader programs as inputs.
The mesh and material data get processed by various stages of the GPU pipeline in order to produce pixels in the final render target (an image to which the GPU writes). That render target can then be used as a texture in subsequent shader programs and/or displayed on screen as the final image for the frame.
For the purposes of this article, here are the important parts of the GPU pipeline from top to bottom:
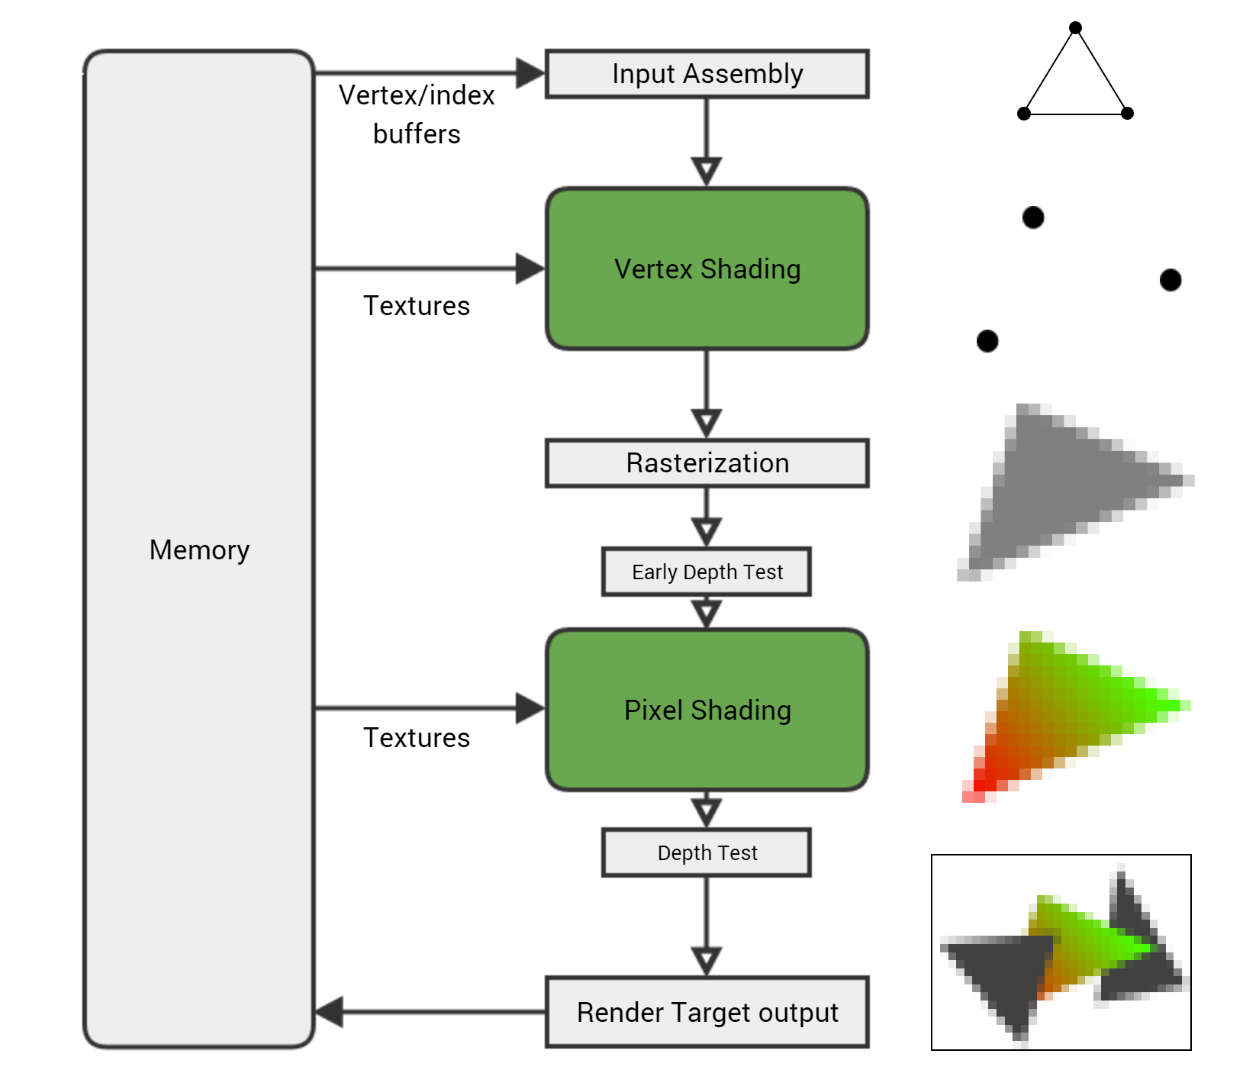
Input Assembly. The GPU reads the vertex and index buffers from memory, determines how the vertices are connected to form triangles, and feeds the rest of the pipeline.
Vertex Shading. The vertex shader gets executed once for every vertex in the mesh, running on a single vertex at a time. Its main purpose is to transform the vertex, taking its position and using the current camera and viewport settings to calculate where it will end up on the screen.
Rasterization. Once the vertex shader has been run on each vertex of a triangle and the GPU knows where it will appear on screen, the triangle is rasterized – converted into a collection of individual pixels. Per-vertex values – UV coordinates, vertex color, normal, etc. – are interpolated across the triangle’s pixels. So if one vertex of a triangle has a black vertex color and another has white, a pixel rasterized in the middle of the two will get the interpolated vertex color grey.
Pixel Shading. Each rasterized pixel is then run through the pixel shader (although technically at this stage it’s not yet a pixel but ‘fragment’, which is why you’ll see the pixel shader sometimes called a fragment shader). This gives the pixel a color by combining material properties, textures, lights, and other parameters in the programmed way to get a particular look. Since there are so many pixels (a 1080p render target has over two million) and each one needs to be shaded at least once, the pixel shader is usually where the GPU spends a lot of its time.
Render Target Output. Finally the pixel is written to the render target – but not before undergoing some tests to make sure it’s valid. For example in normal rendering you want closer objects to appear in front of farther objects; the depth test can reject pixels that are further away than the pixel already in the render target. But if the pixel passes all the tests (depth, alpha, stencil etc.), it gets written to the render target in memory.
There’s much more to it, but that’s the basic flow: the vertex shader is executed on each vertex in the mesh, each 3-vertex triangle is rasterized into pixels, the pixel shader is executed on each rasterized pixel, and the resulting colors are written to a render target.
Under the hood, the shader programs that represent the material are written in a shader programming language such as HLSL. These shaders run on the GPU in much the same way that regular programs run on the CPU – taking in data, running a bunch of simple instructions to change the data, and outputting the result. But while CPU programs are generalized to work on any type of data, shader programs are specifically designed to work on vertices and pixels. These programs are written to give the rendered object the look of the desired material – plastic, metal, velvet, leather, etc.
To give you a concrete example, here’s a simple pixel shader that does Lambertian lighting (ie. simple diffuse-only, no specular highlights) with a material color and a texture. As shaders go it’s one of the most basic, but you don’t need to understand it – it just helps to see what shaders can look like in general.
float3    MaterialColor;
Texture2D MaterialTexture;
SamplerState TexSampler;

float3 LightDirection;
float3 LightColor;

float4 MyPixelShader( float2 vUV : TEXCOORD0, float3 vNorm : NORMAL0 ) : SV_Target
{
    float3 vertexNormal = normalize(vNorm);
    float3 lighting = LightColor * dot( vertexNormal, LightDirection );
    float3 material = MaterialColor * MaterialTexture.Sample( TexSampler, vUV ).rgb;

    float3 color = material * lighting;
    float alpha = 1;

    return float4(color, alpha);
}
A simple pixel shader that does basic lighting. The inputs at the top like MaterialTexture and LightColor are filled in by the CPU, while vUV and vNorm are both vertex properties that were interpolated across the triangle during rasterization.
And the generated shader instructions:
 dp3 r0.x, v1.xyzx, v1.xyzx
 rsq r0.x, r0.x
 mul r0.xyz, r0.xxxx, v1.xyzx
 dp3 r0.x, r0.xyzx, cb0[1].xyzx
 mul r0.xyz, r0.xxxx, cb0[2].xyzx
 sample_indexable(texture2d)(float,float,float,float) r1.xyz, v0.xyxx, t0.xyzw, s0
 mul r1.xyz, r1.xyzx, cb0[0].xyzx
 mul o0.xyz, r0.xyzx, r1.xyzx
 mov o0.w, l(1.000000)
 ret
The shader compiler takes the above program and generates these instructions which are run on the GPU; a longer program produces more instructions which means more work for the GPU to do.
As an aside, you might notice how isolated the shader steps are – each shader works on a single vertex or pixel without needing to know anything about the surrounding vertices/pixels. This is intentional and allows the GPU to process huge numbers of independent vertices and pixels in parallel, which is part of what makes GPUs so fast at doing graphics work compared to CPUs.
We’ll return to the pipeline shortly to see where things might slow down, but first we need to back up a bit and look at how the mesh and material got to the GPU in the first place. This is also where we meet our first performance hurdle – the draw call.
The CPU and Draw Calls
The GPU cannot work alone; it relies on the game code running on the machine’s main processor – the CPU – to tell it what to render and how. The CPU and GPU are (usually) separate chips, running independently and in parallel. To hit our target frame rate – most commonly 30 frames per second – both the CPU and GPU have to do all the work to produce a single frame within the time allowed (at 30fps that’s just 33 milliseconds per frame).

To achieve this, frames are often pipelined; the CPU will take the whole frame to do its work (process AI, physics, input, animation etc.) and then send instructions to the GPU at the end of the frame so it can get to work on the next frame. This gives each processor a full 33ms to do its work at the expense of introducing a frame’s worth of latency (delay). This may be an issue for extremely time-sensitive twitchy games like first person shooters – the Call of Duty series for example runs at 60fps to reduce the latency between player input and rendering – but in general the extra frame is not noticeable to the player.
Every 33ms the final render target is copied and displayed on the screen at VSync – the interval during which the monitor looks for a new frame to display. But if the GPU takes longer than 33ms to finish rendering the frame, it will miss this window of opportunity and the monitor won’t have any new frame to display. That results in either screen tearing or stuttering and an uneven framerate that we really want to avoid. We also get the same result if the CPU takes too long – it has a knock-on effect since the GPU doesn’t get commands quickly enough to do its job in the time allowed. In short, a solid framerate relies on both the CPU and GPU performing well.
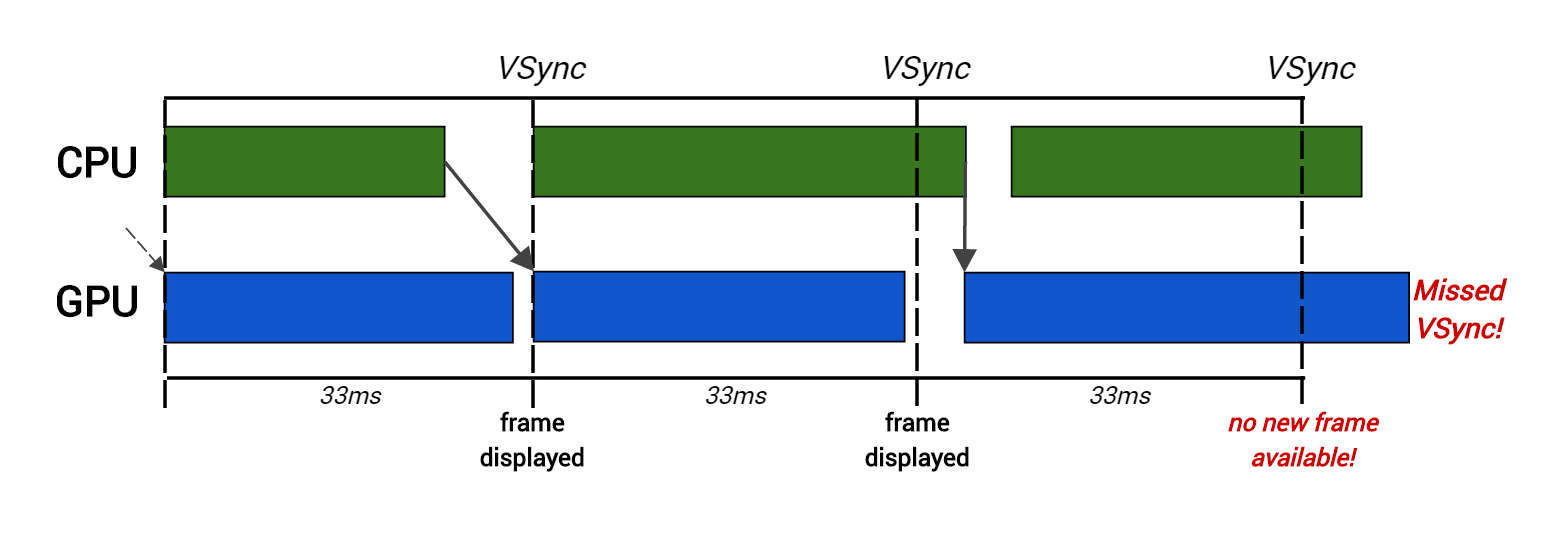
Here the CPU takes too long to produce rendering commands for the second frame, so the GPU starts rendering late and thus misses VSync.
To display a mesh, the CPU issues a draw call which is simply a series of commands that tells the GPU what to draw and how to draw it. As the draw call goes through the GPU pipeline, it uses the various configurable settings specified in the draw call – mostly determined by the mesh’s material and its parameters – to decide how the mesh is rendered. These settings, called GPU state, affect all aspects of rendering, and consist of everything the GPU needs to know in order to render an object. Most significantly for us, GPU state includes the current vertex/index buffers, the current vertex/pixel shader programs, and all the shader inputs (eg. MaterialTexture or LightColor in the above shader code example).
This means that to change a piece of GPU state (for example changing a texture or switching shaders), a new draw call must be issued. This matters because these draw calls are not free for the CPU. It costs a certain amount of time to set up the desired GPU state changes and then issue the draw call. Beyond whatever work the game engine needs to do for each call, extra error checking and bookkeeping cost is introduced by the graphics driver, an intermediate layer of code written by the GPU vendor (NVIDIA, AMD etc.) that translates the draw call into low-level hardware instructions. Too many draw calls can put too much of a burden on the CPU and cause serious performance problems.
Due to this overhead, we generally set an upper limit to the number of draw calls that are acceptable per frame. If this limit is exceeded during gameplay testing, steps must be taken such as reducing the number of objects, reducing draw distance, etc. Console games will typically try to keep draw calls in the 2000-3000 range (eg. on Far Cry Primal we tried to keep it below 2500 per frame). That might sound like a lot, but it also includes any special rendering techniques that might be employed – cascaded shadows for example can easily double the number of draw calls in a frame.
As mentioned above, GPU state can only be changed by issuing a new draw call. This means that although you may have created a single mesh in your modelling package, if one half of the mesh uses one texture for the albedo map and the other half uses a