Welcome back, game connoisseurs. I’m excited to have you.
Today, we’re going to be diving into a continuation of where we left off last, giving you a clear rundown for how to understand the nuances of your LiveOps cadence and actually affect process change for optimal results.
In our Part II series breakdown, we got into the cadence specifics: the design, the implementation, the operations — we looked at all of it. And I hope it’s still fresh in your memory. But now, we’re leaving those pillars behind for something more personal. Something more actionable. Something more fun.
In other words? We’re getting into the observation — and the adjustments.
This is where the magic happens.
It’s where you learn, grow, and improve. It’s where you get your team aligned and rolling in the same direction, and it’s where you give your thinking caps the wear and tear they deserve. It is, for all intents and purposes, the place where your designing and implementing truly pay off.
Observing and adjusting. It sounds so simple. But the truth? The truth is that these pillars carry a lot of weight — and if you don’t have a roadmap for delineating where you should pause, when you should reflect, and how you should improve, it can be daunting.
Today, I’m going to be your roadmap through all things Part III. We’re going to get into the nitty-gritty, unravel the mystical, and zero in on the elements that really matter. And we’re even going to have some fun doing it.
Ready to go? Great — hop on board. First stop: the basics.
The Basics
If you’ll recall from our past meeting, I’ve given you a couple of examples for when time for observing and adjusting needs to be built into the cadence schedule:
When it’s ‘fixing day’ immediately after a new release
When you’re plotting out how long tasks will take
When it’s been a couple of sprints, and it’s time for your team to reflect
But now, let’s expand our sights and think bigger. Not just inside your internal operations, but how your internal operations are actually impacting your game — and the people who love it.
How do you know if your LiveOps cadence is actually working?
If your playerbase is engaged? If the new content is exciting? If your audience is motivated to come back day after day, week after week — without getting bored, annoyed, or overwhelmed?
Simple: you observe.
You track engagement levels. You analyze behaviors. You make sense of which player segments are responding to what content, and you make absolutely certain that you’re paying attention to what your people are telling you.
No, they won’t be telling you with their words. They’ll be telling you with their actions. And it’ll be those actions that enable you to understand what’s working and what isn’t — and to adjust until you get it right. Or, at the very least, closer to right.
The Observation
So how do you observe? Not just broadly, but effectively?
It all starts with the right KPIs. Sure, it’s a common tendency to look at the big guns of metrics — the metrics that feel splashy, or vast, or grandiose. But these metrics — namely, the DAU and ARPU — leave much to be desired in the realm of LiveOps observation.
Observation gives you key insights into the big-picture of your game.
Observation gives you key insights into the big-picture of your game.
Because while the Daily Active User and Average Revenue Per User numbers might lend some insight into the big-picture business of your game, they won’t give you any enlightenment into the LiveOps themselves. They won’t give you the details — the substance — you need to authentically improve your cadence strategy.
So that’s where the rest of the metrics come in. And I’ll be frank with you: there’s a lot of them. But before diving into these KPIs, there are a couple of factors you need to take into account first:
Time: This first factor is more than just a trivial variable — it’s absolutely crucial to gleaning the insight you’re hoping to glean. Because you can look at any metric, at any number, and try to find insight. But you won’t secure it unless you’re giving your observation the context it needs to shine.
Here’s a basic example: using one of the KPIs I mentioned above, you observe that your DAU is currently at 3,000. So what does that tell you? Without comparing it to what your DAU was a month ago, or a year ago, or in 2019 — you have no ability to understand where your game’s headed. Are you gaining traction? Losing it?
Time is the ingredient you need to make sense of your analytic efforts. You’ll want to compare the same KPI against itself at different times in order to figure out what it’s really telling you. Before an event, and then again after. At the beginning of the month, and then again at the end. Before a major marketing campaign, and then again after it’s wrapped up.
Time gives your analytics the frame they need to empower your decision-making. So when you’re pinpointing which KPI’s you’ll be looking at, make sure you have access to previous data — and that you’re planning to take stock of that same data at the next interval.
Population: The second factor to consider when you’re gearing up to get into your analytic mindset is population — which means, who of your players you’ll be analyzing. With the power of audience segmentation, you can divide your player-base into groups and analyze each individually.
This gives you the control you need when you’re looking to observe trends — so that you can further personalize your LiveOps for specific subsets of your audience. Whether you divide your population up by region, game history, or skill level, you’ll be able to discern which engagement tactics and offerings compel which players. And that insight is not only actionable, but massively significant to keeping your churn rate low.
Do you have to split your KPIs into more segmented data pools for your analytics to be effective? No. But it is a useful technique to keep close by — for whenever you do want a more focused understanding of what’s happening.
And why.
Main KPI categories for your LiveOps
User Growth
As the name tells you, this vertical of observation looks at whether people are coming into your game as new players or leaving after having played. Aside from the obvious significance of being able to prove that your game is growing in appeal — or losing traction — user growth can also help you determine which content is responsible for increasing or decreasing your success. When you pick the right times to read the metric — i.e. right before and right after a specific event — you’re able to absorb contextually-significant results. And make further decisions based on them.
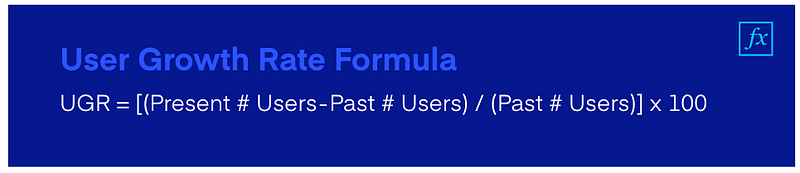
There are a variety of KPI’s that make up this category, including straightforward metrics like installations and uninstallations, registrations and upgrades, and, of course, the User Growth Rate itself. Interested in tracking the User Growth Rate for your game? Follow this formula:
UGR = [(Present # Users — Past # Users) / (Past # Users)] x 100
User Growth Rate formula for your game
User Growth Rate formula for your game
Engagement
This category is going to be your team’s focus as you ascend the rocky terrain of long-term LiveOps. KPIs under the engagement umbrella don’t just tell you whether people are accessing your game or not — they actually tell you how they’re interacting with it.
Are they opening the app by accident and quickly clicking back to the home screen? Are they spending hours, multiple times a week, pursuing game progress? Are they getting frustrated by a certain level — or are they only coming into the game when there’s a community-based event going on?
The lifeblood of successful LiveOps is understanding your audience. With engagement-centered metrics, that’s exactly what you’ll be doing.
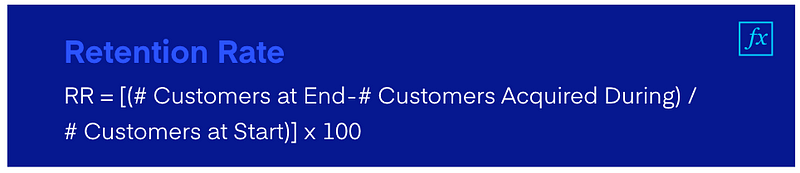
So which KPIs are involved here? There’s the Retention Rate, for starters, where you can quantify how many of your players are still around past a certain time threshold (of your choosing). This gives you the power to track how ‘sticky’ — or compelling — your game is at the beginning, and how much more engaging each dose of fresh content helps it become. It’s more of a generalized look, but it’s useful nonetheless. To find the Retention Rate, use this formula:
RR = [(# Customers at End — # Customers Acquired During) / # Customers at Start)] x 100
To find the Retention Rate, use this formula
To find the Retention Rate, use this formula
Aside from the Retention Rate, you can look at metrics like the App Open Rate, Session Length, Session Integral, and Session Depth. With that data, you’ll be able to see how many times the average player opens the game, how long their play session is, how long they go between play sessions, and how many interactions they have with the game during each session.
Tracking all of these things is always illuminating, but tracking them before and after new content releases is especially fruitful for figuring out what works.
Marketing
While I haven’t gone into much detail (yet) about the importance of marketing as it relates to your LiveOps efforts, I’m going to give you the lowdown on the marketing metrics you’re going to want to observe anyway.
The backbone to remember here is that, without the meat of a captivating, engaging, and enduring game, your marketing can’t issue real results. Sure, it can bring about quick flashes of new players — but if there’s nothing to keep them interested, they won’t stay around for long. To get your players engaged for a long time, you need a remarkable LiveOps cadence. And to get your players advocating for your game on your behalf, you need an extraordinary one.
That’s what our marketing KPIs look at: whether your audience is engaged enough with your game to do more than just play it — but spread it. The first KPI we’ll look at is Social Shares, which enables you to pinpoint how many times your game has been shared on your players’ social media. By being able to glean just how frequently your players are telling their networks about the game, you’ll have a deeper understanding of how many players are serious fans — and the points at which they became them.
The second metric — that’s a little bit more open to interpretation in terms of approach — is Brand Awareness. Where does your game come up in search results, and how many times is it there? Are there thousands of posts on social media mentioning it, or just a handful? If it has social accounts of its own: how many followers does it have? How many interactions a day, or a week? With Brand Awareness, you get a better read on how visible your game is — and with that context in mind, you’ll be able to better assess your markers for growth and engagement. (Because obviously, if you have massive visibility and a barely-moving growth lever, you need to do some reassessing.)
💡Marketing 101 Tip: There’s a big difference between awareness and affinity. Awareness can grow, but something magical happens when people love something and get to affinity status.
Brand awareness turned into affinity (oversimplified)
Brand awareness turned into affinity (oversimplified)
That just about covers the observation breakdown. Now onto the execution.
The Adjustments
Once you’ve put in the strides to observe, you likely have a whole host of data — and a good sense of where and how you need to tweak your LiveOps. Whether the findings are obvious, like a substantial number of players uninstalling the game after a specific event, or whether they’re a little bit more cloudy — the insight is there.
But, your findings aren’t the be all and end all. They’ll give you the right frame to work in — but then, it’s time for you to work.
Let’s take a look at two structural systems for smooth, productive, and fruitful