
Whenever we make games the main important part we miss is Optimizing the game. Resulting, getting lags, low FPS, and even in High-end devices in the worst case. Most of the people will always consider Optimizing the game as the last phase and that's where the first mistake happens it should always be first in your list.
Making sure on every build, every day when we add a new Mechanic or new lighting setup or any physics-based systems for your game its always a good habit of giving build just to check if any performance issues happened because of the new things we’ve added its a good way of developing games.
In the last phase, it will be a problem for you and your game without spending time on any performance optimization from the beginning of the game. Here I want to share some thoughts and tips on how we can increase your game performance based on a few practical things that I learned through my mistakes over the past 5years.

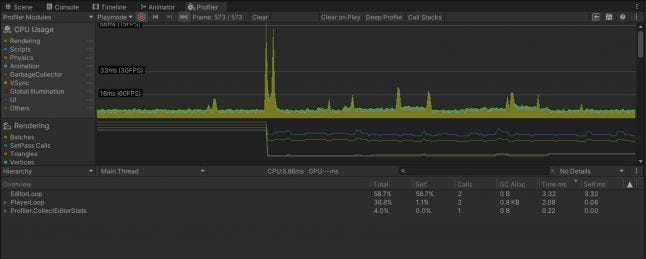
First in the list and one of my favorite tools in Unity to monitor the game performance to know what is actually causing performance issues. This is a very useful one to get an in-depth look at how your game is performing in various changes in the Editor.
 You can find the Profiler under Window->Analysis->Profiler.
It will display categories such as CPU usage, GPU usage, Rendering, Physics, Audio, and more. We cannot depend on the Editor Profiling as the editor affects the performance of the project while testing and the profiling information can be inaccurate sometimes. Its always good to give a separate build to get accurate profiling data.

You need to Install Android SDK and JDK and USB debugging enabled to make it work. Always remember its always good to test how your game performing when it comes to mechanics, UI scaling, etc.. Not to check your actual real game performance with this. To check actual game performance you need to give a build for profiling.
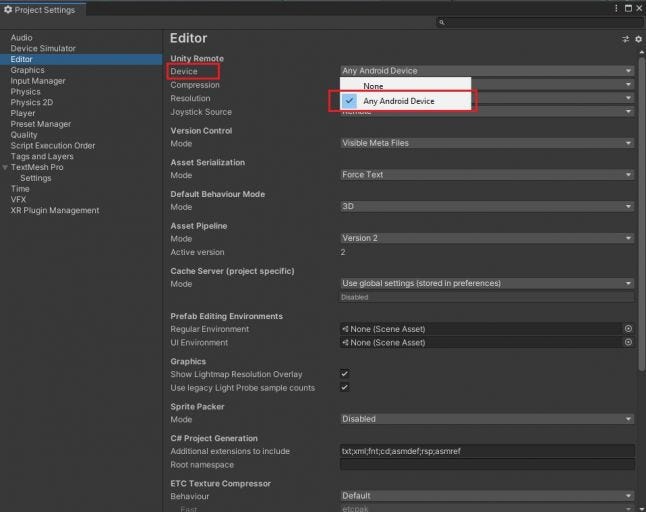
To enable Remote Profiler goto Edit > Project Settings > Editor and under Device choose Any Android Device.

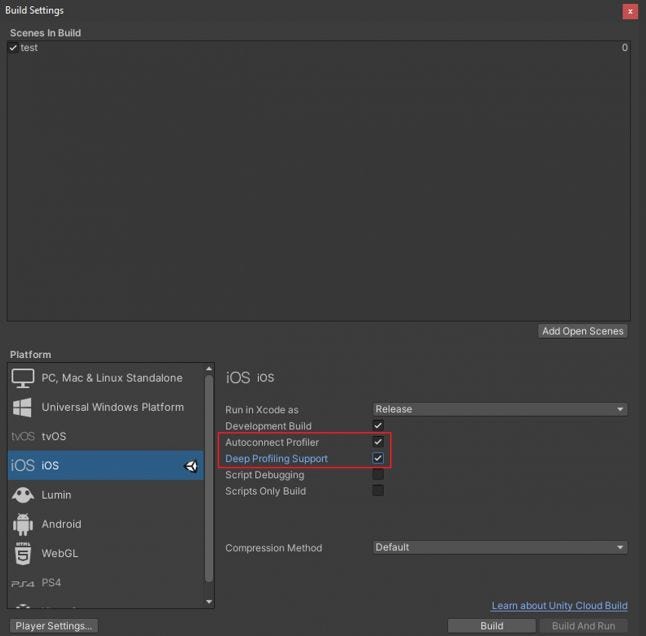
To make sure Unity has access to your build which can be profiled, you should turn on “Development build or Deep Profiling Support” and “Auto-connect Profiler” in Build Settings before making a build. This allows the Unity Editor to connect your build automatically.
Once your build is ready keep open Unity Profiler window and open your game. Now Unity will automatically show the current build game performance data in the Profiler Window.
You can learn more about Profiler here.

Batching is a very good method to improve performance by reducing Draw calls which are the game Objects rendering of similar objects into the same draw call instead of multiple. There are two types of Batching methods Static and Dynamic. There’s some limitation to the Batching which means we cannot batch skinned meshes, cloth, and some rendering components.

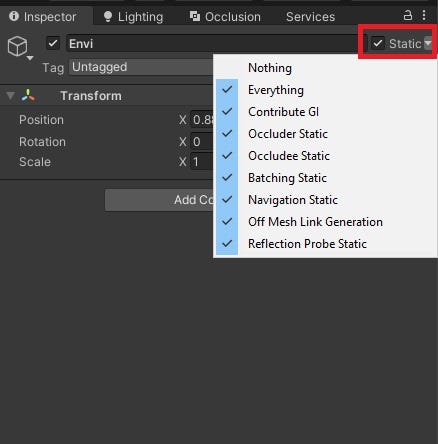
Static batching is used whenever Game Objects set to static, these static game objects shouldn't be moved, scaled, or rotate and also should use the same Material on all static game objects to make batching work.
If your gameObjects doesnt interact with your Player or if you don’t change any Transform its always the best option to use Static Batching in most cases Environments in your game such as buildings, roads etc.

Dynamic batching is similar to Static which uses the same Materials on game objects but can batch moving objects no need to flag static. Basically Unity can automatically batch GameObjects into the same draw call if they share same Material but they are some limitations to make Dynamic batching work as per Unity:
Batching dynamic GameObjects has certain overhead per vertex, so batching is applied only to Meshes containing no more than 900 vertex attributes, and no more than 300 vertices.
If your Shader
is using Vertex Position, Normal and single UV, then you can batch up to 300 verts, while if your Shader is using Vertex Position, Normal, UV0, UV1 and Tangent, then only 180 verts.: attribute count limit might be changed in future.
GameObjects are not batched if they contain mirroring on the transform (for example GameObject A with +1 scale and GameObject B with –1 scale cannot be batched together).
Using different Material instances causes GameObjects not to batch together, even if they are essentially the same. The exception is shadow caster rendering.
GameObjects with lightmaps
have additional renderer parameters: lightmap index and offset/scale into the lightmap. Generally, dynamic lightmapped GameObjects should point to exactly the same lightmap location to be batched.Multi-pass Shaders break batching.
Almost all Unity Shaders support several Lights in forward rendering
, effectively doing additional passes for them. The draw calls for “additional per-pixel lights” are not batched.The Legacy Deferred (light pre-pass) rendering path
has dynamic batching disabled, because it has to draw GameObjects twice.
For Particle Systems, Line Renderers, Trails Renderers Dynamic batching works differently compared to how it work for Meshes.
For each compatible renderer type, Unity builds all batchable content into 1 large Vertex Buffer.