Our game Defender's Quest will be five years old in just a few days, which is a good opportunity for a retrospective on how Steam has changed in that time.
On November 8th of this year, Steam launched its much anticipated Discovery update 2.0.

I've written previously about the earlier Discovery update 1.0 here.
Discovery update 2.0 has only been out for about a month, so it's hard to precisely measure what effect it's had, but we've now got plenty of data on the effects of Discovery update 1.0. As you can see, we've got a "Stegosaurus Tail" chart -- a long tail with spikes:

This chart shows our monthly gross revenue from Steam since we launched there in late 2012 (Defender's Quest originally launched off-steam in January 2012, selling direct and via web game portals like Kongregate). I've broken the revenue into two categories stacked on top of each other -- promoted, and residual. Promoted means anything tied to a sale, major event, or anomalous source of external traffic, and residual is everything else -- the basic revenue your game gets by random users finding your game on Steam without any special force pointing them towards it.
Our early sales spikes were dominated by hand-picked features -- things like Steam's Daily Deal, a spot in the front-page capsule rotation (back when they showed the same games to everyone in the entire world at once), and the guaranteed launch promotion that each game used to get back when there were less than 2,000 on all of Steam. This was a privileged position to be sure, and it couldn't possibly last. We were one of the very last games allowed onto Steam before Steam Greenlight unleashed a torrent of changes.
Not only did competition for promotions escalate, organic sales dried up as the catalog became too big for players to browse. We fought hard to stay afloat, but one thing's for sure -- if not for Steam Discovery update 1.0, our game would have drowned by now. We certainly wouldn't have been able to keep updating it for four years (soon to be five). As soon as Discovery Update 1.0 hit, daily sales immediately shot up. That trend has continued to this day:

This chart shows the average daily revenue for a given month, excluding promotional periods. This gives a more accurate sense of what's coming in from Steam's daily internal traffic without any special attention shining on the game.
Residual revenue has fluctuated a bit since then, but has never returned to its historic lows in the old boom-bust days. We can see a slight upwards tick since Discovery update 2.0, but it's a little too early to say anything conclusive since we only have a month's data so far.
NOTE: In June 2016 we launched the Defender's Quest Deluxe edition update, That likely confounds data analysis a bit.
One of the consequences of Steam opening the Greenlight floodgates was that the regular seasonal promotions became major letdowns. In the early days we made a good amount of revenue from them, but as more games got onto Steam, the number of people randomly browsing to our page during the sales shrunk to nearly zero, and the sales promotion pages themselves consisted almost entirely of hand-picked features. This meant that if you weren't among the selections, you basically got no seasonal sales traffic whatsoever. And the hand-picked selections were usually big games that were already selling well. It was a bit of a catch-22.
That started to change with Discovery update 1.0.
Here's a chart from a previous article that details this phenomenon, look at the revenue comparison for the Autumn (Black Friday) sale, as well as the change in residual daily revenue: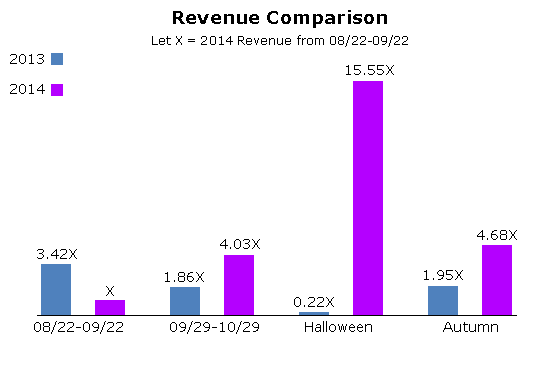
The first bar (blue) is from a residual period in 2013 and the second (purple) is from the same period in 2014, just before the Discovery 1.0 update. We see that revenue is much lower one year later. The next two bars show the effect of the udpate -- the third bar (blue) is a residual period in 2013, and the fourth (purple) is the same period in 2014, but this time the 2014 bar is just after the Discovery 1.0 update. As you can see it's not only not less than 2013, it's much greater. For a more in-depth analysis, see the original article.
You should probably ignore the spike in Halloween sale revenue in 2014 as that was largely down to a lucky fluke for us rather than any changes in the Discovery algorithm.
As for promotions and sales, around Autumn of 2014, the Discovery engine started to power the sales themselves, and Steam no longer showed the same static list of big-name games to every player in the world. Instead, they customized the sales pages, surfaced items from people's wishlists, and added trading card incentives to crawl the Discovery Queue.
The upshot of all of this is that we were about to fall off a cliff in 2014 (the game was three years old after all), but the Discovery update held us steady and slowed the descent, and in this past year we actually reversed the downwards trend of year-over-year revenue:

Keep in mind, this is for a five-year-old offline single-player game, with no DLC or microtransactions. Not exactly Hearthstone or Civilization V.
So how can you replicate our success? I've absolutely no idea. All I can do is list some things we did that I think were important and seemed to work for us, and try to back that up with whatever data I have available.
Visibility Rounds
Here's something that's definitely changed since Discovery update 2.0. Steam has this feature called "Visibility rounds", which used to be good for a guaranteed 500,000 "views" on the Steam front page. Everyone got a few of these, you'd spend them to bring attention to a sale or something, and people who performed well were eligible for more.
The way they used to work (near as I can figure) was to make your game appear immediately to the next 500,000 people who loaded the Steam store front page. This not only resulted in dismal click-through rates for all but the most popular, mass-appeal games, but would also cause a typical game to blow through all 500,000 views in less than a day, sometimes even within a single hour. It was a nice gesture from Valve, but didn't make much of a difference.
After Discovery update 2.0, this changed. Take a look:

The first two visibility rounds ran before the 2.0 update, and the last one started December 12th, 2016.
As of this writing, it's still running.
Instead of spamming a general audience as quickly as possible, the new system now strategically slow-burns your views, doling them out to people that are more likely to click through. There's a catch, however -- you're no longer guaranteed to reach 500,000 total views; it seems to just run for a month or so and you get as much as the algorithm can reach (also, the visibility update seems to pause during major promotions like the Holiday sale). At least in our case, this change was a major benefit -- with half the total views so far, we've garnered more than 4 times as many overall clicks, with a click through rate ~8.6x better than before. I've heard scattered reports from other developers about similar improvements (and complaints from one or two who have not fared as well).
Update: A commenter from reddit points out:
The main complaint for Visibility Rounds now, is that they only show major updates to game owners or people who have wishlisted the game. People who wishlist are generally waiting for a discount, and owners probably won't buy additional copies, so the net result can be very disappointing.
Crucially, they do not provide any new visibility. Nobody will see the game if they haven't already, and even then they probably won't. This means that games with small audiences will not see a benefit for supporting and updating their product using Visibility Rounds.
Your mileage may vary.
Obviously I'm biased since this one came out in our favor, but it seems like the old system was unsustainable anyways -- as more games come onto Steam, eventually the entire front page would be taken up by people cashing in visibility tokens for their guaranteed 500K views.
Speaking of views, let's look at where our overall traffic came from.
Traffic Reports
Steam added traffic reports back in 2014 along with Discovery update 1.0. Traffic data only goes back as far as the Discovery update 1.0 launch, but here's a chart of all of our lifetime traffic since then:

Broken down by category:
Category | % Visits |
|---|---|
Discovery Queue | 32.32 |
Search | 18.05 |
Home Page | 14.2 |
Tags | 8.08 |
External site | 6.51 |
Specials |